Interpreting the Least Squares Regression Equation
One way to determine the "best fit" line is to look at the vertical distances between each of the observations and the line. That is, we focus on minimizing the prediction errors or "residuals" (e.g., how far the observed brain densities are from densities predicted by the line).
- Check the Show Residuals box (under the Show Movable Line box when checked).
- Continue to adjust your line to see whether you can make the sum of the absolute values of the residuals (SAE) even smaller.
- Now uncheck the Show Residuals box and check the Show Squared Residuals box.
- Continue to adjust your line to see whether you can make the sum of the squared values of the residuals (SSE) even smaller.
It can be shown mathematically that there is one line, the least squares regression line, that does the best job possible of minimizing the sum of the squared residuals. The equation is of the form y-hat = a + bx.
For example, the graph below show the least squares regression line for predicting a person's height from their foot length.
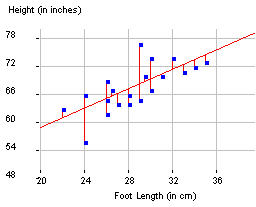
The least squares regression equation is predicted height = 38.302 + 1.033 x footsize where 38.302 is the intercept and 1.033 is the slope.
Interpretations:
- The intercept coefficient of a least squares regression line, a, is interpreted as the predicted value of the response variable (y) when the explanatory (x) has a value of zero. For example, this model predicts that a person with zero foot length has height 38.3 inches. Although in many contexts (such as the predicted height for someone with zero foot length), this prediction may not make much sense!
- The slope coefficient of a least squares regression line, b, is interpreted as the predicted change in the response variable (y) associated with a one-unit increase in the explanatory variable (x). For example, the predicted increase in height associated with each additional centimeter in foot length is 1.033 inches (how much taller we expect a person's height to be if the foot length is 1 cm longer).
- In the applet, check the boxes next to Show Regression Line and Show Squared Residuals. Is the SSE value smaller than what you found (check the Show Suqared Residuals for the movable line too)?
- Uncheck the Show Movable Line and Show Squared Residuals boxes and take a screen capture with the regression line superimposed on the scatterplot and the equation displayed and place in your report.
(d) Identify the values of the intercept and the slope, and (following the examples above) provide a detailed (statistical) interpretation of both the slope and intercept coefficients (for the red least squares regression line) in the Facebook/Brain Density study context. Hint: Remember that the explanatory variable here is how many hundred Facebook friends the person reports.

