Step 4: Make inferences beyond the data
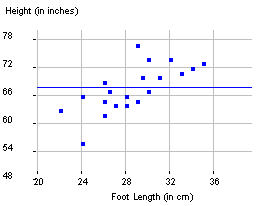
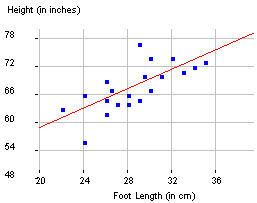
In particular, the slope coefficient b is what we want to focus on. If the slope coefficient equals zero, that corresponds to no linear relationship between the two variables - the best fitting line doesn't change in height as the explanatory variable changes (see line in figure on left below). When this line is not sufficient, we get a nonzero slope value (see line in figure on right below).
But we need to realize that if the researchers had selected a different sample of students, they would have obtained a different sample regression line. So we need to consider the slope as a statistic in the sense that its values will vary from sample to sample. So, again, our usual question is: What is the pattern of variability in these regression slopes from different random samples?
We can define  ("beta") to refer to the slope of the regression line in the entire population. If there is no overall association between these two variables in the population, than = 0.
So we want to know about the sampling variability from sample to sample of the sample slope coefficient under the null hypothesis that = 0. Knowing this will help us determine whether a particular observed sample slope coefficient is surprising to occur by chance alone when the null hypothesis is true.
(e) If our research conjecture is that more Facebook friends will tend to correspond to larger brain density values, what does this imply about the value of the population slope? State this, in symbols, as the alternative hypothesis.

