Research Question 2: Do students who report back problems tend to carry more weight (higher ratios)?
(d) Is whether or not students report back problems a quantitative or a categorical variable?
Descriptive Statistics
(e) Use an technology to produce numerical and graphical summaries comparing the backpack to body weight ratios for those with and without back problems.
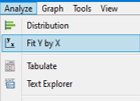
- Choose Analyze > Fit Y by X
- Move ratio into the Y, Response box and >Back problems into the X, Factor box.
- Press OK
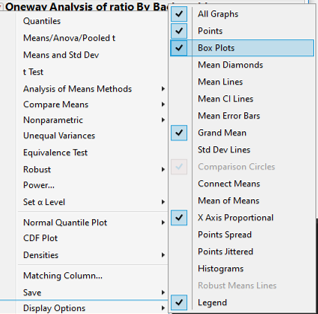
- Use the hot spot to select Display Options > Box Plots.
- Use the hot spot again to select Means and Std Dev
.
|
  |
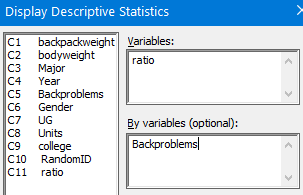
- Choose Stat > Basic Statistics > Display Descriptive Statistics
- Move the ratio variable to the Graph variables box and then click in the By variables box and enter the Backproblems variable.
- Press the Graphs button and choose Boxplot of data
- Press OK twice.
|
 |
- boxplot(backpackdata$ratio~backpackdata$Backproblems, horizontal=T)
|
- In the Excel file, get the ratio and Backproblems columns next to each other. Make sure the Backproblems header is one word.
- Copy and paste these two columns two your clipboard
-
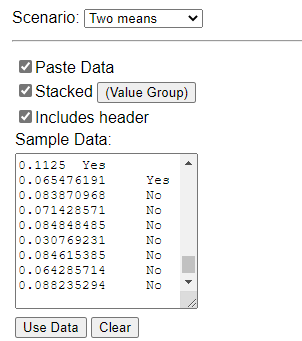
Open the Theory Based Inference applet
- Use the pull-down menu to select the Two means scenario.
- Check the Paste data, Stacked, and Includes header boxes.
- Paste in the two columns from your clipboard.
- Toggle the (Value Group) button to match the format of your data.
- Press Use Data.
|
 |
Include this output in your report.
(f) Write a paragraph comparing the behavior of the ratios in these 2 groups (any similarities, any differences), remembering all previous lessons on what to talk about.

