Research Question 3: Is there a difference in the likelihood of male and female Cal Poly students to report back problems?
Descriptive Statistics
(h) Which variable (gender or whether or not have back problems) would you more naturally consider the explanatory variable in this context?
(i) Use technology to create a two-way table (with the explanatory variable as the columns), and a segmented bar graph or mosaic plot to compare the distributions of back problems for males and females. Copy the output into your report.
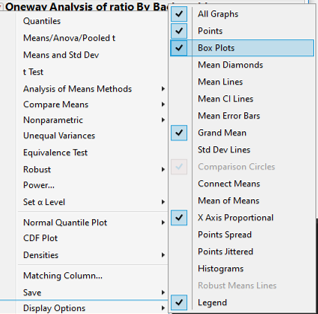
- Choose Analyze > Fit Y by X
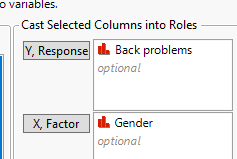
- Move Backproblems into the Y, Response box and >Gender into the X, Factor box.
- Press OK
.
|
  |
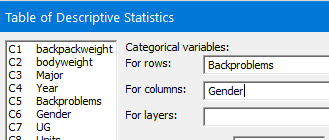
- Choose Stat > Tables > Descriptive Statistics
- Specify the Backproblems variable in the For rows box and then click in the For columns box and enter the Gender variable. Press OK.
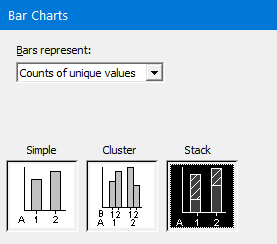
- Choose Graph > Bar Chart and select the Stacked option. Press OK.
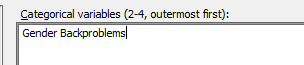
- Enter Gender and then Backproblems in the Categorical varible box.
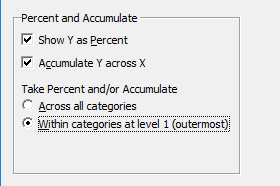
- Press the Chart Options button and select Show Y as Percent, Accumulate Y across X, and Within categories at level 1.
- Press OK twice.
|
    |
- table(backpackdata$Backproblems, backpackdata$Gender)
- barplot(prop.table(table(backpackdata$Backproblems, backpackdata$Gender), margin=2), legend=T, ylab="back problems?", xlab="Gender")
|
- In the Excel file, get the Gender and Backproblems columns next to each other. Make sure the Backproblems header is one word.
- Copy and paste these two columns two your clipboard
-
Open the Multiple Proportions applet
- Press Clear.
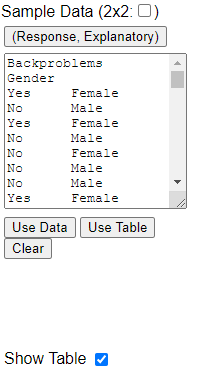
- Click in the data window and paste in the two columns from your clipboard.
- Toggle the (Explanatory, Response) button to match the format of your data.
- Press Use Data.
- Check the Show Table box.
- Optional: Use the pull-down menu to switch to a mosaic plot.
|
 |
(j) Summarize what you learn.

