Chi-Square Statistic
Another possible statistic for quantifying how different the observed sample proportions are is the chi-square statistic. Here is one version of how to calculate the statistic for a binary response variable:
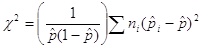
where ![]() is the overall proportion of successes for the entire sample and the ni are the sizes of the three treatment groups. Note: The S symbol stands for "sum all the values." You can consider this statistic as the sum of the squared z-statistics from the (common) overall proportion of successes.
is the overall proportion of successes for the entire sample and the ni are the sizes of the three treatment groups. Note: The S symbol stands for "sum all the values." You can consider this statistic as the sum of the squared z-statistics from the (common) overall proportion of successes.
(j) Calculate the overall proportion of successes (donors) for all 161 responses.
(k) Calculate the observed chi-square statistic for the study data: Compare each conditional proportion to this overall proportion. Then square each of these values. Then multiple each of these values by the sample size for that group. Then sum these three values together. Then divide by the last term, again involving the overall proportion of successes. (Show the details in your lab report.) (Carry a few decimal places along the way and then round to two at the end.)
(l) Return to the applet, and uncheck the Show Shuffle Options box. On the far left panel of the applet, select X2 from the Statistic drop-down menu. Note that the observed value of the chi-square statistic is what you computed in part (k). Now check the Show Shuffle Options box again and simulate 1,000 random assignments. Use this null distribution to find a p-value. Take a screen capture of your null distribution showing the p-value and paste it into your lab report.
(m) Are your p-values for parts (i) and (l) similar? What does this tell you about using the mean group difference statistic versus the chi-square statistic? Does it seem to matter much which one we use to measure how different the observed conditional proportions are?

